TBM 220: Effort vs. Value Curves
The world does not need another prioritization framework.
However, one thing that always bugs me about (many) prioritization conversations is that teams often leave out the expected value curve of the work. “Level of effort” (or complexity, even) has never cut it for me because it assumes one fixed effort point. I am more concerned about the effort/time to impact curve because that (to me) more accurately represents product development.
Instead of prioritizing features, you prioritize a focus area over time, and features are a subset of that decision. Therefore, before jumping in, discussing the hypothesized relationships between effort/time and value for the high-level mission can be very helpful (not matter what framework you are using).
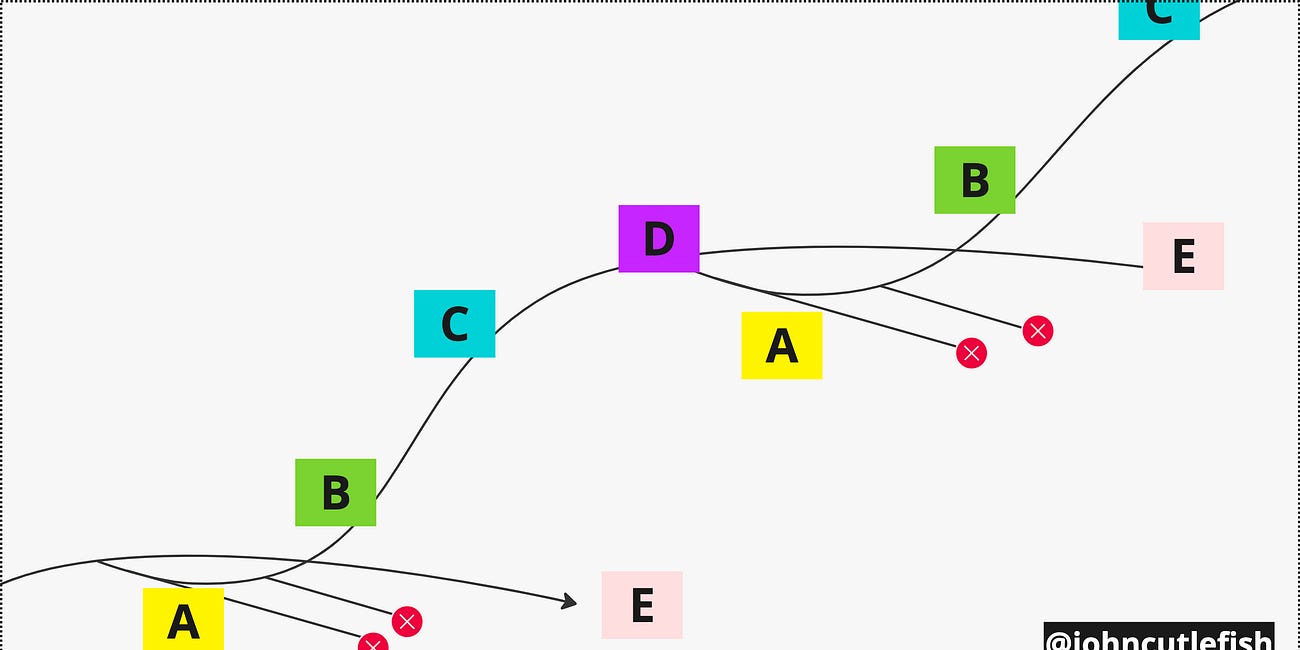
Here’s a diagram…
A. Slow to start, rapid rise, then tapers off (Sigmoid)
Example: Developing a new product feature that initially has low adoption but then becomes a key selling point, leading to a surge in user acquisition and eventually reaching market saturation.
B: Quick win that gradually tapers off with more work (Exponential Decay)
Example: Implementing UX improvements that significantly increase user engagement (initially), but subsequent improvements have diminishing returns as the interface becomes more refined.
C. Fairly linear relationship between work and impact (Linear)
Example: Regular refactoring—fixing debt as you go— can feel like this. There's no "big payoff," but regular practice has a fairly linear relationship with outcomes.
D. Quick win. No need to continue (Step Function)
Example: Fixing a critical bug that was causing major churn. Once the team fixes the bug, churn decreases quickly, and there's no need to continue working on that specific issue.
E. Lots of work. Potentially lots of value later (J-curve)
Example: Expanding into a new geographical market. It takes time and investment (localization, local support/sales, etc.) A potentially big payoff, but it will take time.
F. Even more extreme than "E". Flat value until a future point (Delayed Step Function)
Example: Investing in a major architectural overhaul. The benefits will not be visible until the transition is complete. Still, once done, it could significantly improve scalability and development speed in the future (in theory, these are very risky).
So What?
Why is it important to consider the effort vs. value curve?
It helps clarify statements like “quick wins”. D and B offer “quick wins”, but B doesn’t level off nearly as quickly.
A, E, and F can feel remarkably similar when starting! But the team must prepare for a very different experience and journey.
Sensing inflection points is critical—solid leading indicators can make all the difference.
It shows how much is at risk with F efforts when viewed together. Look at all the area above that line!
It is all very fractal. Consider that the top portion of A could easily resemble B.
When to expect results! As simple as it sounds, setting expectations and when the team might observe progress (instead of being “done”) is extremely helpful.
Some of these curves offer easy “escape routes”, while others demand that teams address areas of risk—and their assumptions of the curve in general—as early as possible.
In general, when I see teams stressing out about prioritizing individual features (or prioritization frameworks), I always recommend that they step back and paint a picture of the high-level curve they are dealing with. That is often far more telling than the effort/impact-specific tactical bets.
Two related posts:
TBM 48/52: Hill Climbing
Are you a full-time product manager, engineer, designer, or data analyst? I would be very grateful if you could participate in this single question survey. The survey involves 1) reading a scenario (about 1-2 minutes) and 2) describing how the scenario would play out at your company. I hope to write about it in the future.
TBM 19/52: A Portfolio of Bets
I encourage teams to think about their roadmap as a portfolio of bets. Different initiatives have different risk/reward profiles. When the strategy and goals change, the mix changes. You can hedge and over-hedge. People often describe startups as risky


Awesome post and analysis. Thank you 🙇
Glorious!
You nailed it.