Are you a full-time product manager, engineer, designer, or data analyst? I would be very grateful if you could participate in this single question survey. The survey involves 1) reading a scenario (about 1-2 minutes) and 2) describing how the scenario would play out at your company. I hope to write about it in the future.
My goal? Describe what happens in the real world—not just what happens at certain high-profile companies. Your help is greatly appreciated.
On to this week’s post.
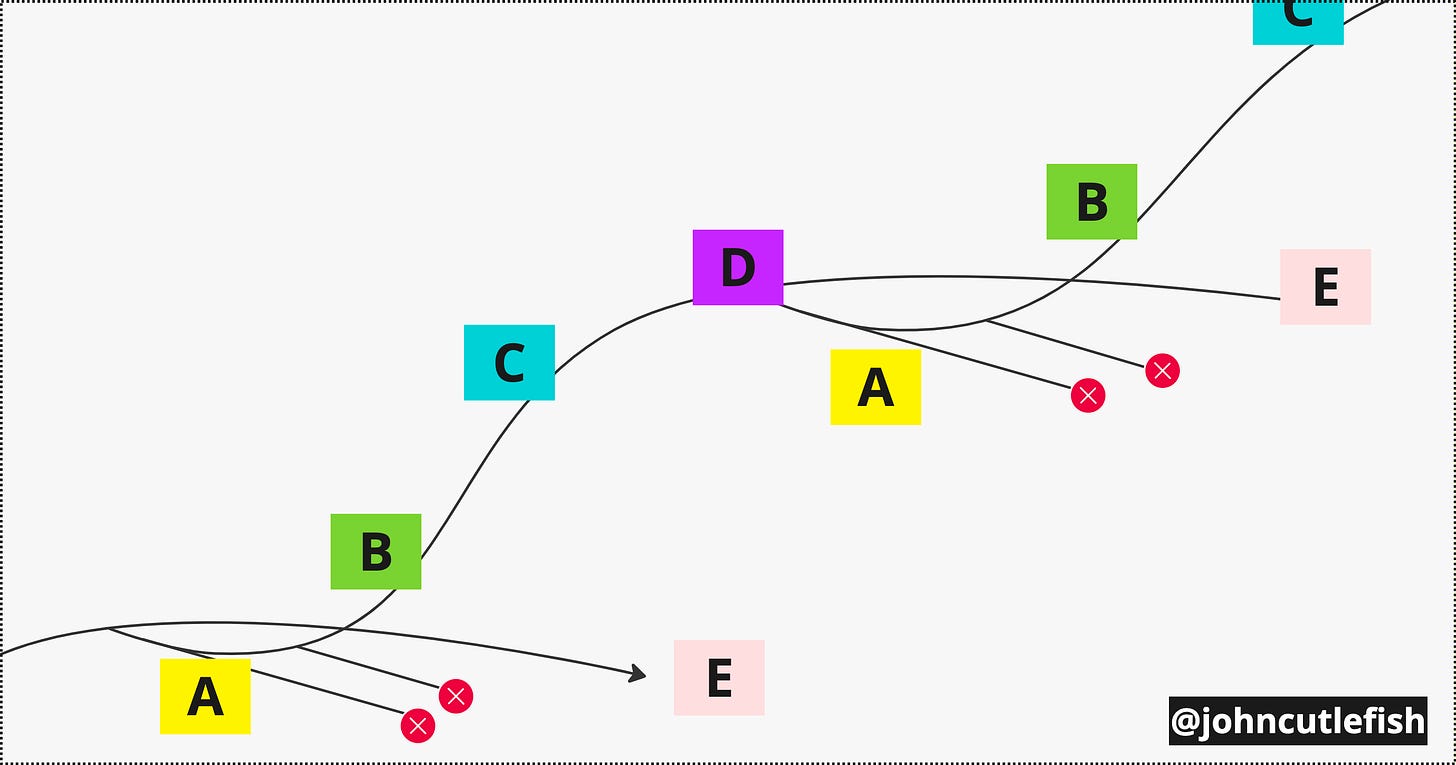
Imagine different product opportunities / bets / puzzles at your company. Some are:
A: Very difficult. Lots of false starts. Exploratory
B: Can't-miss! Low-hanging fruit. Things are on the up-and-up
C: A bit tougher. But you can still make gains. Playground for disciplined optimizers
D: Wins are very hard to come by. Just preventing a slide is an accomplishment
E: A controlled "fall" of sorts as the cycle (hopefully) repeats itself with new As.
The idea of a series of stages is not a new idea. See technological transitions, technology lifecycle, hill climbing, maxima and minima, product life cycle (Theodore Levitt), etc.
Here are some real world examples.
Example #1: Amplitude
Here's an example from my world. At Amplitude, we are:
A: Researching new ways to visualize the impact of product releases. Many argue that "visualization is a solved problem!" But we still believe that there are step changes to be had.
B: We're making lots of quick progress on usage visibility to help customers control costs. It is the right thing to do—even if we profit less in the near term.
C: Collaboration is getting tougher. We've done many "easier" things like dashboards and notebooks, and now we need to be more disciplined. Lots of experiments fail, but we still make steady progress.
D: Without going into too many details, moving massive amounts of data involves the laws of physics (and budgets).
E: Confidential. Because we expect 1) technology shifts and 2) our A bets to materialize, we purposefully deprioritize working on some things.
We have things all over the map.
Example #2: Fleet Management
Here's another example from a friend involved in fleet management. His company has an A (soon to be B) mode happening:
We are focusing on "Non-Dedicated Fleet Managers" who do not have the time and space to do hardcore fleet management and sit behind a desk all day. That focus has opened us up to a different world. We are focusing less on graphs and data visualization and more on notifications with content providing key insights to help non-dedicated fleet managers make the right decision as fast as possible.
Note how addressing a different workflow—someone not at their desk—is a new problem for them. A whole new world. The un-desked person will have very different needs.
C and D (and maybe E):
The area in the optimization space deals with larger fleets with dedicated fleet managers trying to optimize the last 5-10% of their business.
Activity
But as well-known as this idea is, I'm still fascinated by how many companies 1) don't adapt approaches based on "stage" and 2) are unaware of where different things sit. Or their view is highly simplified—they have an "innovation lab" for A, and "stuff we aren't working on" for E—and nothing in between.
Do this exercise with your team.
Challenge yourself to develop five examples for items A through E.
Then pivot the activity to go through some of the significant stable "levers" in your business (for example, in fleet management, the lever is situational awareness about the fleet), and describe the "portfolio of bets" you have in that space.
Example
For the lever “trustworthy data” at Amplitude we might have:
A: ML to detect and remedy data quality issues
B: Basic alerting (“we haven’t seen this event before”)
C: Integrating instrumentation into developer workflows
D: There are limits to certain governance approaches
E: Confidential
Note: Why is E confidential, not A? Interesting side-note: your unique strategy is often much more about what you ARE NOT doing than what you ARE doing :) Everyone is trying to use AI/ML for everything. So no surprise there.
I discuss bet portfolios in this post.
Good luck! And if you have time for that survey, here is the link.


I like this visual and way of thinking with bets to get up a hill. A few years ago building the first product for a saas venture, I started mapping a diagram of all the choices we put off and did not follow.
As I figured if we did really need them after 3 months, we would either know more then or it would be a win as we never needed them. You have just put it better now, and some other reading I have done this year on bets and hypothesis
Lovely!
Reminded me of Flexuous Curves too, another model you probably already know ...
https://twitter.com/tom_d_kerwin/status/1579066286134657024?s=46&t=igocFj7fdS1UUoKnrIMCaQ